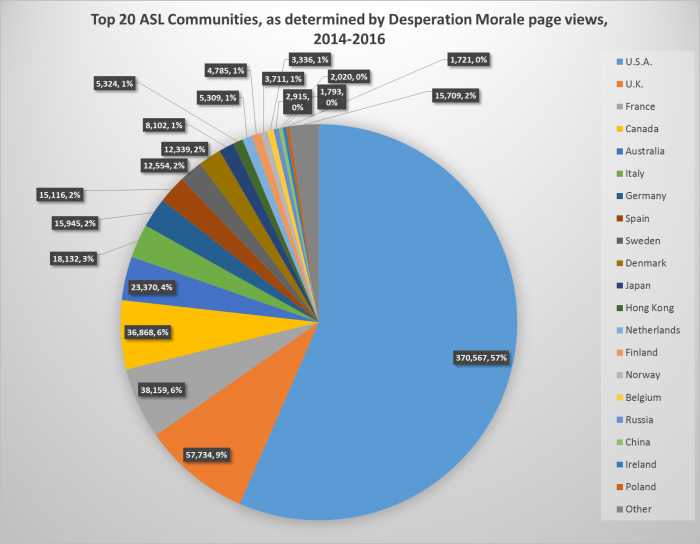
So I went and took the page view totals of the “new” Desperation Morale website (i.e., from around mid-2014 through March 2016; not quite 2 years worth of data) and created a spreadsheet that totaled them up and organized them by country. I took the Top 20 countries, in terms of page views on the Desperation Morale website, and turned that into a pie char that illustrates the relative size of those Top 20 ASL communities in the world. Non-English speaking countries may be slightly under-represented in the percentages on this list, in that some non-English speakers in those countries may not visit my website–but I think most ASL players at least have some written knowledge of English and this is probably a very minor distortion.
The numbers on the chart are not very meaningful–they do not represent individual people. It is the percentages that are more important, as they are likely to be at least somewhat representative of the relative sizes of the ASL communities in those countries. I include the numbers themselves more for the sake of completion than anything else.
The “Other” category includes those countries with very small but nevertheless actual ASL communities, but it also includes a number of countries where the results were so small that they are more likely attributable to bots, spiders, and mistaken clicks. So the actual “other” ASL communities all put together are actually probably significantly smaller than the percentage here.

I hear Other is beautiful this time of year
Interesting stuff. I’d like to see this chart converted to per capita.
Very interesting. When I saw the pie-chart I had a similar thought as Dan Schulz with some difference. I would certainly not replace it as it is very valuable as it is – the absolute figures as well as the percentages. What I mean is, it might be interesting to see a chart in relation to the total population per country. I myself am from Belgium, so our input into the chart is very relative, although interesting.
If you divide DM% by population(2017figures) you get for above top 11
Denmark 0,33%/million, Sweden 0,2, US 0,17, Canada 0,16, Australia 0,11, France 0,08, UK 0,07, Italy 0,05, Spain 0,04, Germany 0,02 and Japan 0,01.
Being a Swede i find it tough to be beaten by Denmark om the other hand i live in the “occupied territory” of southern Sweden so my ancestors are Danish:)
Seems that there is room for marketing this game in Russia and China, many potential customers there considering the have their nations represented in the game.